

- A rising number of flood insurance claims comes from outside designated high-risk areas.
- The problem is especially pronounced in states such as Texas, Maryland, and New York.
- In Florida, Gulf County is especially affected, with claims often exceeding local yearly household income levels.
In the U.S., a substantial proportion of U.S. residential flood insurance claims originate outside designated high-risk areas. For example, in Florida’s Gulf County, the value of a typical claim is now $81,497, a figure that represents 133.2% of the county’s median annual household income ($61,179).
In this analysis, Florida property claim lawyers Anidjar & Levine compare historical insurance claims with current flood-zone designations. With an October 2026 Government Accountability Office (GAO) report highlighting the fact that millions of properties face significant flood risk beyond official high-risk areas, this study pinpoints the states facing the highest share of claims not currently classed as high-risk. We’ll also consider some of the other costs homeowners need to pay in the event of a flood, and the Florida areas most affected by high flood claims.
States With the Highest Share of Flood Claims Outside High-Risk Areas
The aforementioned GAO report emphasizes the gap between FEMA’s flood-zone designations and modeled flood risk, estimating that about 13 million properties with high modeled flood risk lie outside designated high-risk areas. Separately, this study found that 28.1% of residential National Flood Insurance Program claim records for losses in 2014–2024 with a classifiable current flood zone involved properties outside designated high-risk areas.
Of all 30 qualifying states, Texas recorded the highest share (52.1%). Maryland ranked second (45.9%), followed by New York (39.0%). Texas recorded an index score of 185.0, meaning its share of residential flood claims outside designated high-risk areas was 85% higher than the national benchmark.
Top 10 States by Share of Residential Flood Claims Outside Designated High-Risk Areas
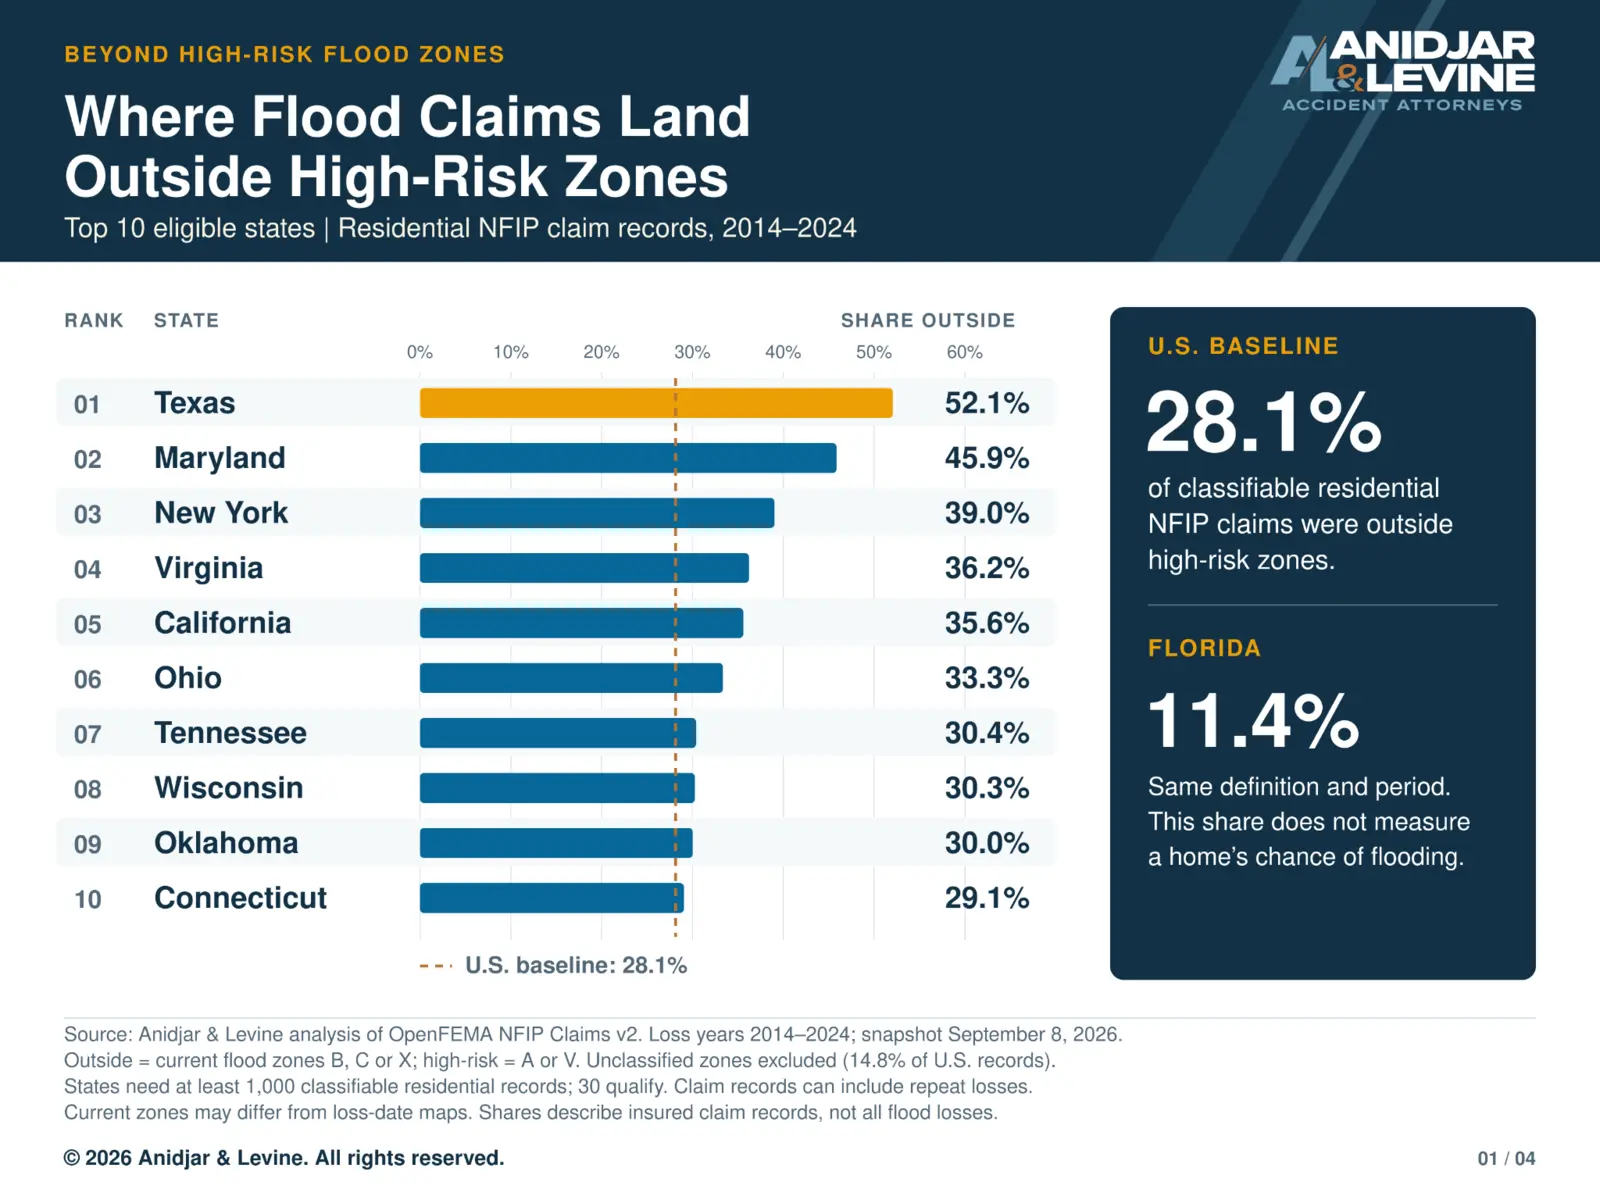
Ten qualifying states exceeded the U.S. residential benchmark, including inland states like Ohio, Tennessee, Wisconsin, and Oklahoma. The pattern clearly shows that claims beyond designated high-risk areas are not confined to coastal regions.
The picture in Florida is very different. The state’s share beyond high-risk zones was 11.4%, meaning it ranked 30th among qualifying states, with an index score of 40.6. The study identified 17,265 outside-zone residential claim records in Florida (compared with 138,288 nationwide). Positive payments on these records were worth $598.4 million in Florida and $7.20 billion across the rest of the country.
(These figures cover the distribution of recorded claims, not the likelihood that an individual property will flood. FEMA separately reports that 29% of all National Flood Insurance Program (NFIP) claims from 2014 through 2024 were from beyond high-risk areas. That figure covers all NFIP claims, whereas this study’s 28.1% benchmark specifically features residential records in identifiable zones.)
Beyond the Flood Zone: America’s Overlooked Properties
Flooding can damage homes that are far beyond designated high-risk areas. Heavy rainfall can also exploit weaknesses in local drainage and stormwater systems. That link is especially relevant in Florida communities like Manatee County, which carries out continuous recovery and infrastructure work.
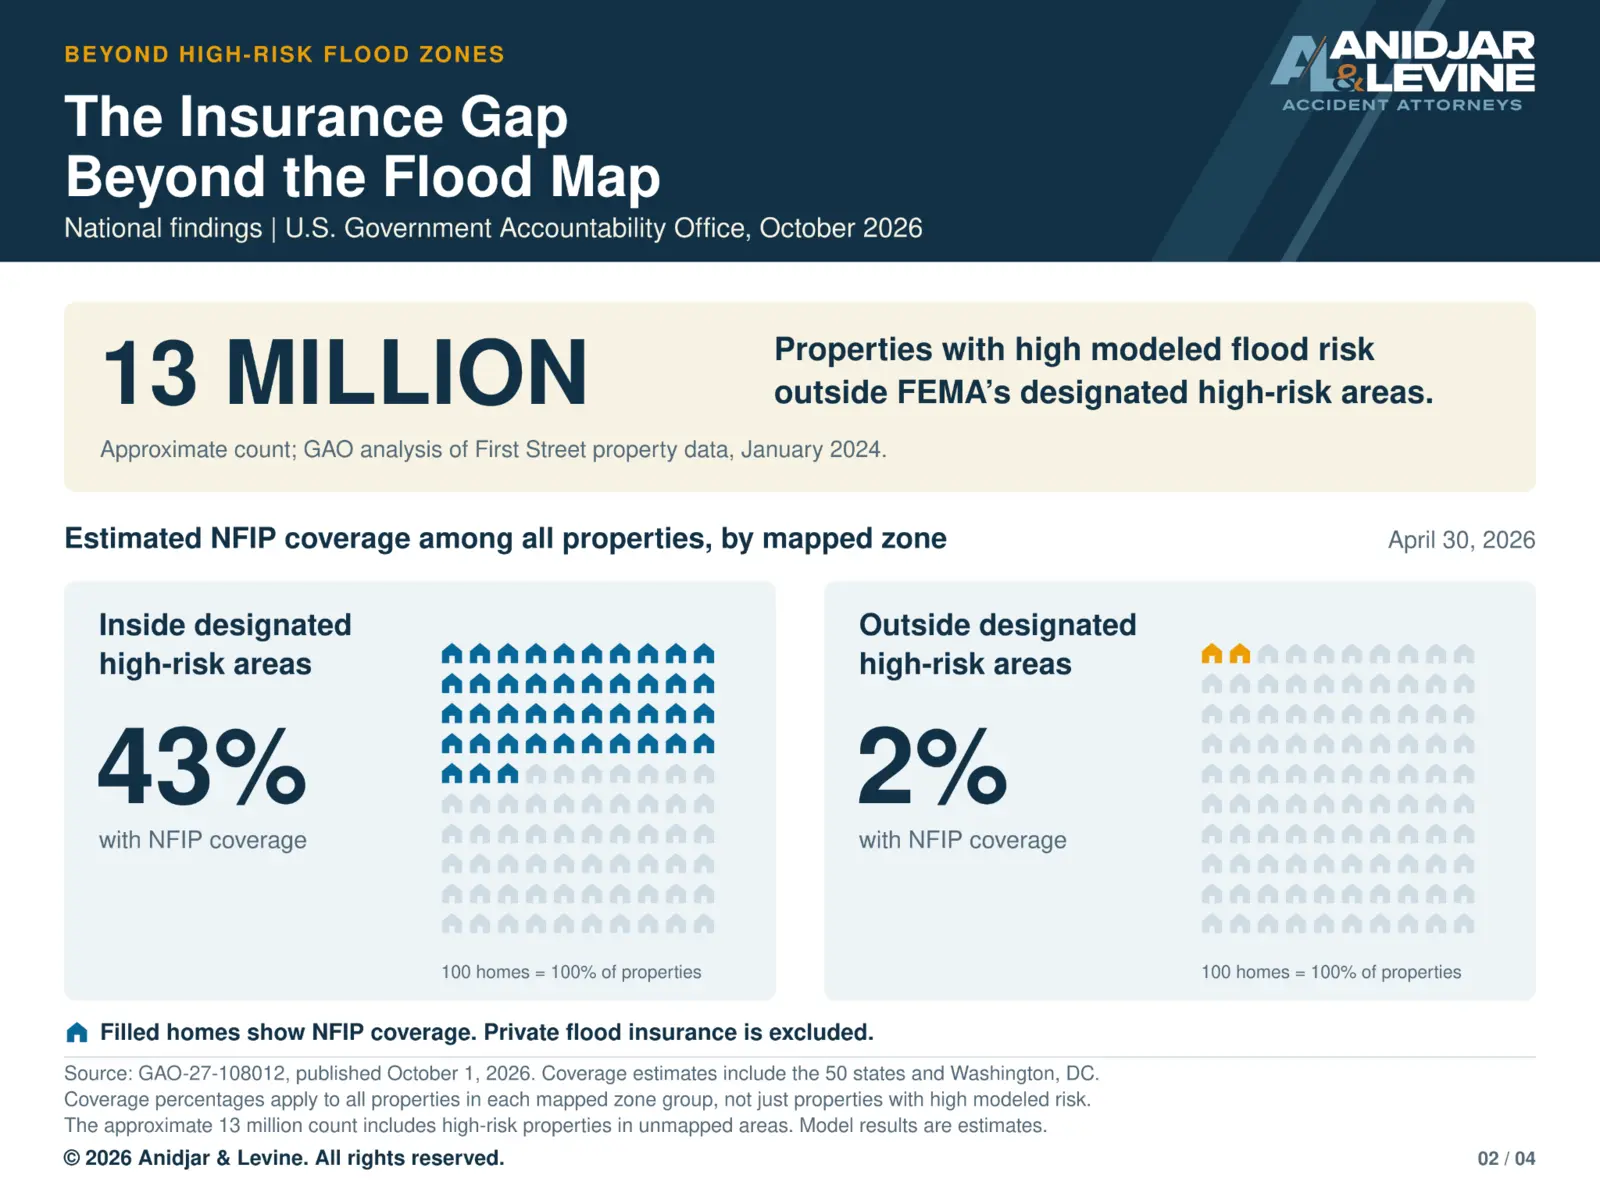
Insurance coverage is an associated problem. While GAO estimated that NFIP coverage reached 43% of the properties within designated high-risk areas, just 2% of damaged properties outside the high-risk areas received coverage. As of April 2026, 86% of modeled high-risk properties were lacking NFIP coverage (this measure doesn’t include private flood insurance, so it shouldn’t necessarily be interpreted as the share without any kind of flood insurance).
The report also highlights the significance of rainfall. Among almost 12.8 million modeled high-risk properties outside SFHAs included in the GAO flood-type analysis, heavy rainfall was the primary risk for 62%.
That statistic offers useful context for local reporting on drainage capacity, stormwater infrastructure, and neighborhood flooding. A property doesn’t need to be adjacent to a major river or the coast to be severely exposed to extreme rainfall and inadequate drainage.
Data from Florida counties illustrates how historical claims beyond designated high-risk areas vary across the state. Bay County’s outside-zone claim share was 48.3%, over four times Florida’s statewide share (11.4%).
There were also notable results in central Florida. In Polk County, claims outside high-risk zones represented 40.5% of classifiable residential claims; other figures include 39.6% in Orange County and 36.8% in Seminole County. On the Atlantic coast, shares reached 30.6% in Duval County and 29.2% in Volusia County.
The figures measure different factors: historical insured losses and modeled flood risk across properties. Combined, they underscore why current flood maps may not capture all aspects of a community’s flood exposure.
The Housing Costs NFIP Flood Policies Leave Behind
For those whose house is still in disrepair after suffering flood damage, an insurance payment may help to repair a home, but it won’t cover all the costs of living elsewhere until work is completed. That’s a key distinction in Florida, where families continue to navigate often long recovery periods after a major storm.
According to study data, primary homes accounted for 83.5% of outside-zone residential claim records nationally and 78.3% in Florida. The figures suggest that the claims frequently involve main homes as opposed to other types of residential property.
In 2024, the national median positive payment for a household claim beyond designated high-risk areas was $43,948. In wider Florida, the median was $26,126; in Manatee County, the median reached $43,436, providing a household-scale comparison to accompany the county’s ongoing infrastructure and recovery work.
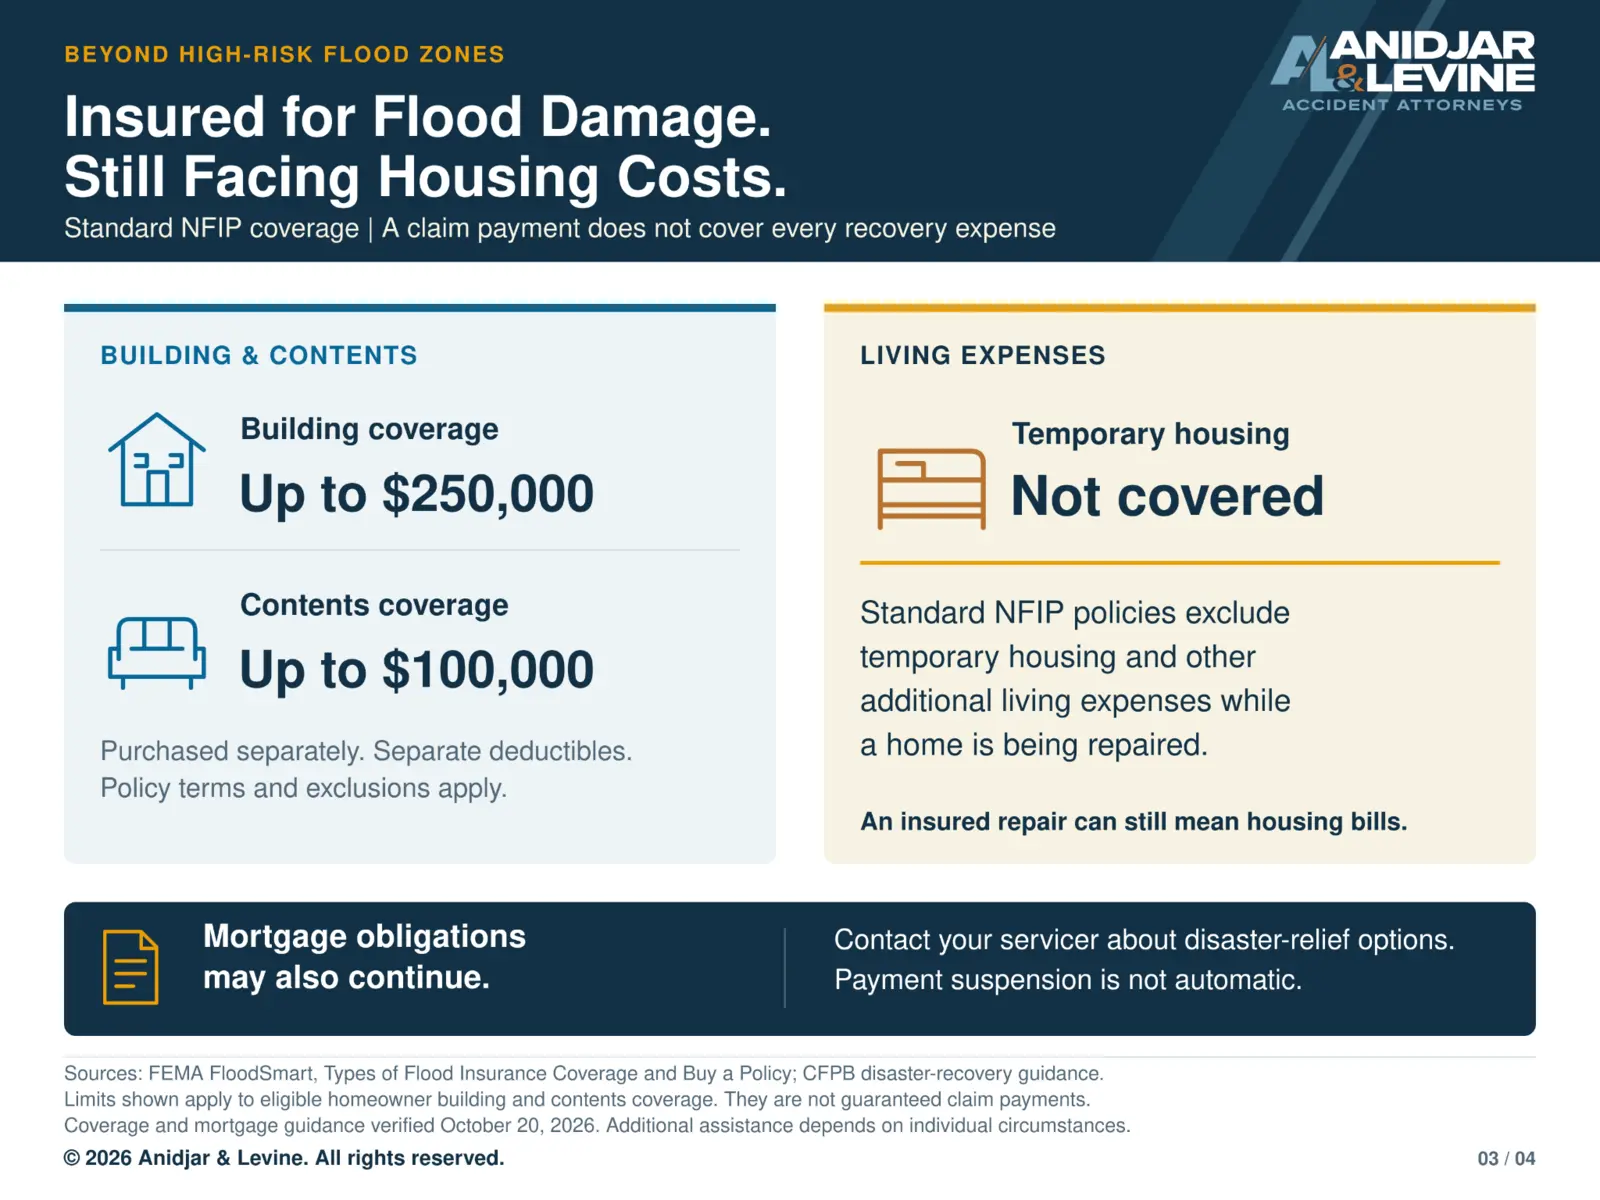
Yet a payment toward covered building or contents damage doesn’t necessarily cover the cost of temporary accommodation. Standard NFIP building and contents policies don’t feature additional living expenses (such as temporary housing). Eligible household policies provide up to $250,000 in building coverage and $100,000 in contents coverage.
Rental-market figures emphasize housing-cost issues without necessarily measuring the costs involved in disaster displacement. U.S. Census Bureau estimates put national median gross rent at $1,413 per month ($1,669 in Florida, 18.1% higher).
While those amounts cover ordinary rental-market benchmarks, not hotel rates or how much displaced occupants spend on accommodation, they provide useful context for the extra financial pressure that may arise due to a home needing extensive repairs.
Federal recovery assistance data also indicates the scale of the problem. FEMA’s November 25, 2025, Florida recovery update recorded $160.7 million in rental assistance to 29,636 families after Hurricanes Helene and Milton.
Households often struggle to absorb unexpected costs. In a Federal Reserve 2025 survey, 63% of adults stated they would cover a $400 emergency expense with cash or its equivalent.
Combined, these findings confirm an important distinction between insured damage repairs and the full costs involved in recovering from a flood. Insurance payments may support a rebuild, but covering the costs of temporary housing and related expenses may necessitate the use of separate resources.
The Florida Counties Where a Flood Claim Equals a Year’s Income
In Gulf County, the median paid household flood claim beyond designated high-risk areas reached as high as $81,497, which is far more than the county’s median annual household income ($61,179). The difference between the two figures is $20,318, and shows an extreme example of covered flood damage relative to household financial capability.
The Anidjar & Levine analysis compared each qualifying county’s median household claim payment with its median annual household income. The resulting index shows the payment as a percentage of annual median income. It’s a comparison at the community level, not an estimate of an individual claimant’s earnings or financial health.
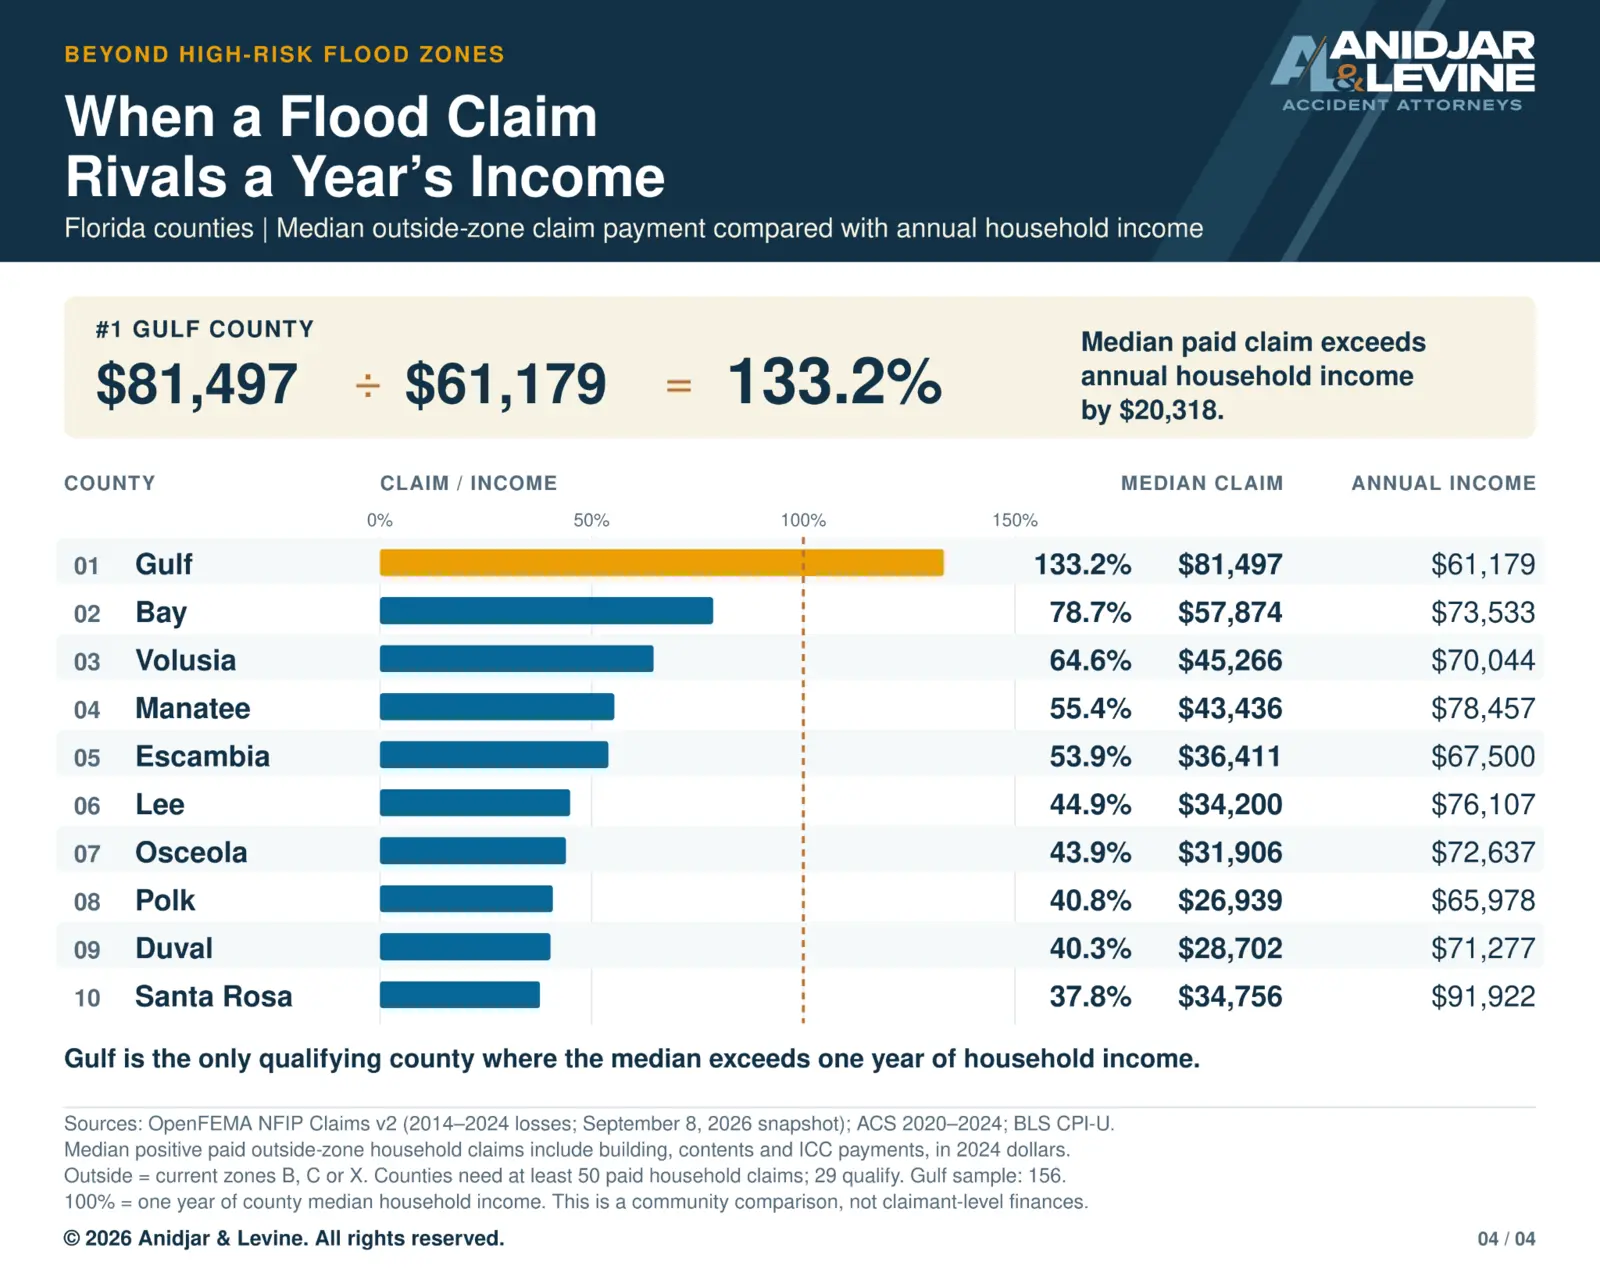
After Gulf County, Bay County ranked second with a median paid claim of $57,874, which is equivalent to 78.7% of its median annual household income ($73,533). Volusia County ranked third at 64.6%, followed by Manatee County (55.4%) and Escambia County (53.9%).
Manatee’s result gives the county’s recovery story a household-scale dimension. Its median outside-zone payment ($43,436) was equivalent to 55.4% of its median annual household income, a significant covered-loss payment relative to a typical year’s wages.
The national comparison illustrates the scale of the payments. The median positive household claim beyond the high-risk zone was $43,948, equivalent to 54.4% of the national median annual household income ($80,734).
(These figures shouldn’t be mistaken for FEMA’s separately published average NFIP payment of $82,614 for 2020-2024, which covers all NFIP claims during a different period and uses an average as opposed to this study’s median for a specific subset of household claims.)
The distinction between medians and averages is an important one. For example, in Bay County, the mean paid household claim was $95,830, far higher than the $57,874 median. A smaller number of large payments can inflate an average, which means the median is more useful for comparing a typical payment with the local median income.
The comparison doesn’t mean claimants received an amount equal to their income. Additionally, it doesn’t measure the full rebuilding costs. Instead, it shows how a typical insurance payment for covered damage compares with the county income benchmark.
A Flooded Home Doesn’t Automatically Pause a Mortgage
Flood damage can leave homeowners simultaneously facing repairs, insurance negotiations, and regular housing payments. For Florida residents, the upcoming January 2027 Citizens Property Insurance coverage requirement adds extra impetus for them to carefully examine how their current policies address flood risk.
Data identifies 13,523 outside-zone residential claim records that involve primary residences in Florida. Primary residences represented 95.6% of outside-zone residential claims in Seminole County, 93.4% in Orange County, and 89.8% in Polk County.
Insurance payments vary significantly. Florida’s mean paid household claim for properties outside the high-risk zone was $56,673 (compared with a median of $26,126). The gulf emphasizes why an average can’t describe the amount of recovery funding available to all households.
Meanwhile, housing costs continue irrespective of whether repairs are complete. U.S. Census Bureau estimates put the median selected monthly mortgage homeowner costs at $1,963 nationally and $1,959 in Florida. The measure includes mortgage payments and other housing expenses (like property taxes, insurance, and utility charges) as opposed to the mortgage payment alone.
Per year, the figures equal $23,556 nationally and $23,508 in Florida and provide a recurring housing-cost benchmark, not an estimate of what flood claimants paid while living in temporary accommodation or repairing their homes.
Household budgets are often already stretched: according to a Federal Reserve 2025 survey, 16% of U.S. adults stated they hadn’t paid all their bills during the previous month. (That finding provides a broader financial context but doesn’t establish that flood damage caused any missed payments.)
The Consumer Financial Protection Bureau advises borrowers that home damage doesn’t lead to the automatic suspension of mortgage-payment obligations. Homeowners should get in touch with their mortgage servicer to discuss disaster-related options, which may include forbearance or a repayment plan, depending on individual arrangements.
For Florida homeowners who are reviewing their level of protection ahead of the January 2027 Citizens coverage requirement, there are three practical steps that may help.
- Check the details of current coverage. Confirm the property’s status regarding its flood-zone designation, policy exclusions, and whether separate flood insurance is necessary.
- Document damage and communications. Keep all records of property damage, photographs, insurance claims, repair estimates, and correspondence with insurers.
- Contact the mortgage servicer. Ask which disaster-related arrangements are available, what the eligibility conditions are, and how relief would affect future payments.
A flood claim can provide funds for covered damage, but it won’t necessarily cover all recovery expenses or prevent ongoing housing obligations. Understanding the limits of insurance and the options available via a mortgage servicer can help homeowners make the right decisions during recovery.
An Evolving High-Risk Map Leaves a Shortfall
Overall, our analysis of FEMA flood claim data confirms that many residential claims are now outside defined high-risk flood zones. Our Florida findings also highlight the potential financial strain of flood damage on households in Gulf and Manatee communities.
Ultimately, as flood risk extends beyond official high-risk maps, insurance payouts may fall short. As what’s defined as ‘high-risk’ evolves, homeowner coverage will also change. For now, homeowners need to make sure they understand their flood coverage, prepare for unexpected housing costs, and appreciate what mortgage assistance options may be available after a flood strikes.
When a weather event strikes your home or business, the damage can be significant. If you live on or near the coast in Florida, your property can be severely affected by flooding, while rain and hail from storms can also cause significant damage.
Florida property claim lawyers at Anidjar & Levine can help you file your claim and submit the necessary documentation. We can deal with the insurance company and look out for your interests.
Sources
S1. FEMA OpenFEMA, NFIP Redacted Claims v3. Claims snapshot September 8, 2026; retrieved October 20, 2026. https://www.fema.gov/openfema-data-page/nfip-redacted-claims-v3
S2. Florida Department of Health, FLHealthCHARTS, Census ACS Table B19013. 2020-2024 ACS 5-year estimates, in 2024 dollars. https://www.flhealthcharts.gov/ChartsReports/rdPage.aspx?cid=0293&rdReport=NonVitalIndGrp.Dataviewer
S3. BLS, historical annual average CPI-U. 2014-2024 annual averages; 2024 base year. https://www.bls.gov/cpi/tables/supplemental-files/historical-cpi-u-202412.pdf
S4. FEMA FloodSmart, What Is My Flood Risk?. 29% benchmark: loss years 2014-2024; average payment: 2020-2024. https://www.floodsmart.gov/flood-zones-and-maps/what-is-my-flood-risk
S5. U.S. Government Accountability Office, GAO-27-108012. Published October 1, 2026; NFIP coverage estimates as of April 2026. https://www.gao.gov/products/gao-27-108012
S6. FEMA FloodSmart, Types of Flood Insurance Coverage. Current guidance checked October 20, 2026. https://agents.floodsmart.gov/topics/selling-flood-insurance/coverage
S7. U.S. Census Bureau, QuickFacts, United States. 2020-2024 ACS housing costs, rent and income, in 2024 dollars. https://www.census.gov/quickfacts/fact/table/US/PST045225
S8. U.S. Census Bureau, QuickFacts, Florida. 2020-2024 ACS housing costs, rent and income, in 2024 dollars. https://www.census.gov/quickfacts/fl
S9. Federal Reserve, Economic Well-Being of U.S. Households in 2025. Published May 19, 2026; survey fielded October 2025. https://www.federalreserve.gov/publications/2026-economic-well-being-of-us-households-in-2025-executive-summary.htm
S10. Consumer Financial Protection Bureau, disaster financial recovery guidance. Current guidance checked October 20, 2026. https://www.consumerfinance.gov/ask-cfpb/what-should-i-do-after-a-disaster-to-protect-my-finances-and-property-en-1513/
S11. Citizens Property Insurance Corporation, flood insurance requirements. Current requirement schedule checked October 20, 2026. https://www.citizensfla.com/flood
S12. Manatee County, infrastructure recovery project approvals. Board action October 7, 2026; announcement posted October 8. https://www.mymanatee.org/connect/news-and-information/news-and-information/article-detail/board-of-county-commissioners/2026/10/08/manatee-county-approves-over--100-million-in-project-funding-for-infrastructure-recovery
S13. FEMA, Florida Helene and Milton Recovery. Recovery update dated November 25, 2025. https://www.fema.gov/fact-sheet/florida-helene-and-milton-recovery
S14. GAO, full report, GAO-27-108012. Heavy-rainfall breakdown of modeled high-risk properties. https://files.gao.gov/reports/GAO-27-108012/index.html
Methodology
Anidjar & Levine analyzed FEMA OpenFEMA NFIP Redacted Claims v3 records for loss years (2014-2024), using the September 8, 2026, source snapshot (retrieved October 20, 2026).
The national study covers the 50 states and the District of Columbia. For the state analysis, current flood zones beginning with A or V were classified as high-risk, while zones B, C or X were classified as outside high-risk areas. Records with other or missing zone classifications were excluded from zone-share denominators.
The state index was calculated by dividing each state’s outside-zone residential claim share by the national residential claim share and multiplying the result by 100. For a state to be ranked, it needed at least 1,000 classifiable records.
For the Florida county payment-to-income analysis, the study used positive paid claims for individual household habitations. Claims associated with shared multi-unit buildings and condominium associations were excluded. Building, contents, and Increased Cost of Compliance payments were combined and adjusted to 2024 dollars using the annual Consumer Price Index for All Urban Consumers (CPI-U) published by the U.S. Bureau of Labor Statistics.
Median payments were divided by the corresponding county’s 2020-2024 American Community Survey median household income and multiplied by 100 to calculate the claim-to-income index. Counties required at least 50 qualifying paid claims.
The analysis measures historical insurance records relative to current flood-zone classifications. It doesn’t estimate the probability of future flooding at an individual property, identify the insurance status of every property, or establish a claimant’s personal income, total rebuilding costs, or out-of-pocket expenses.